Creating the material world through data, one million inventions at a time
Every breakthrough in materials science has been made by accident and we don’t have the time for that anymore.
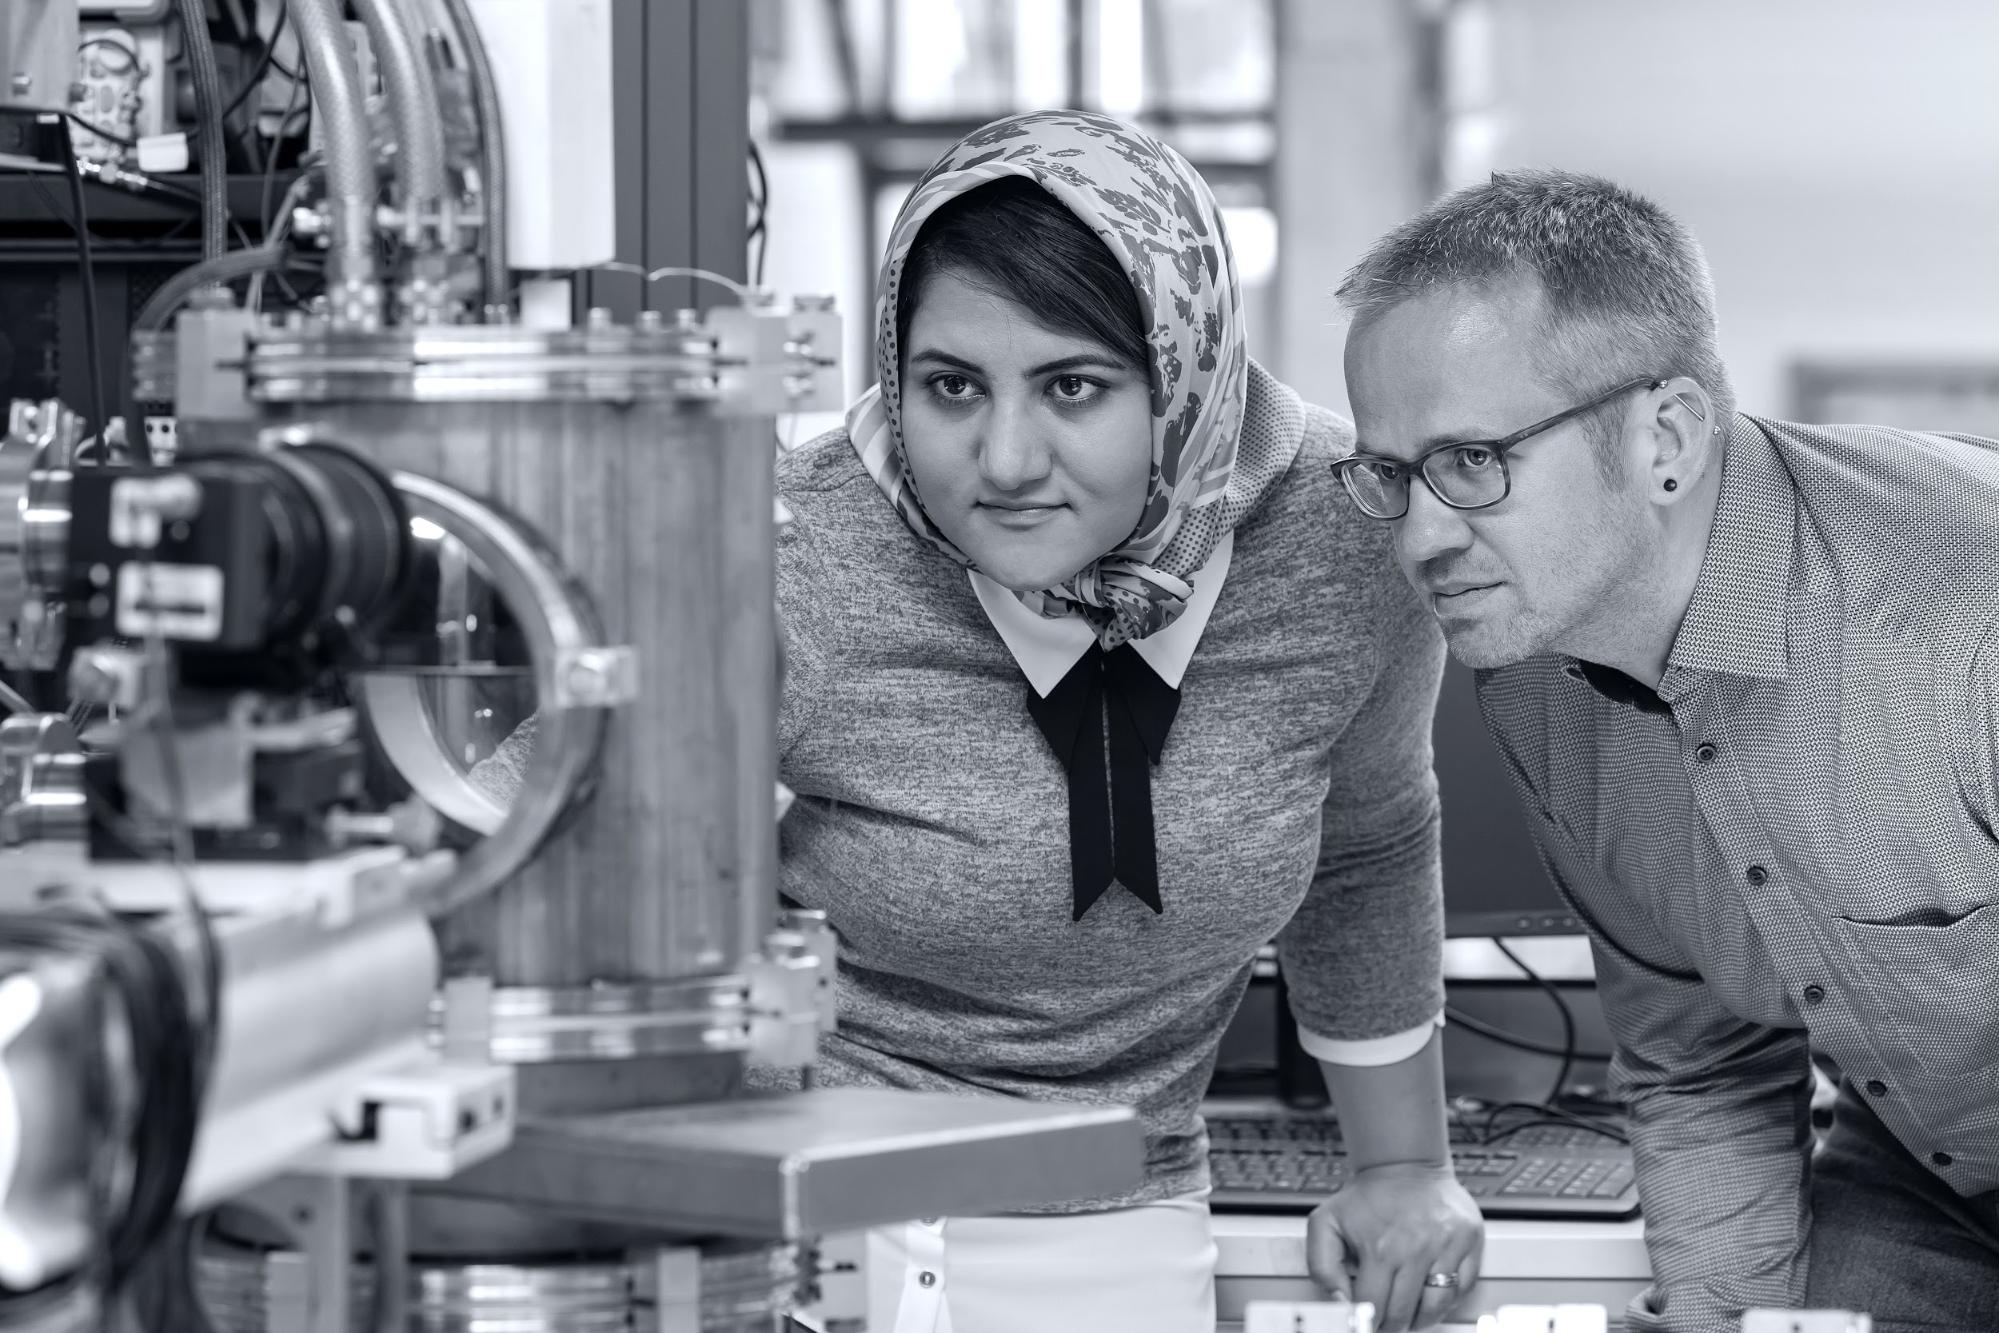
Dr. Nils Ellendt, CEO of the Collaborative Research Centre
Stone. Bronze. Iron. The great ages of our species are defined not just by our technology, but by the materials we make it from. When US President John F. Kennedy announced the Apollo project in 1962, the biggest gamble of the space age, he not only said, “We choose to go to the moon,” but added it would be on the backs of materials “not yet invented”.
Today, to bring the process of inventing new materials into the 21st century, one more raw material must be added: data.
A universe of possibilities
Every technology you touch or see, that feeds you or moves you, depends on materials for its strength, durability and lightness. These materials need to be invented, just as much as the technology itself needs to be invented. But the rules for developing new materials are very different.
All the useful materials ever made are composed of one or more of the 80-odd naturally occurring compound-forming elements. This might seem a manageable set of building blocks. However, a material’s properties depend not just on which elements are in it but on how the atoms fit together – the structure.
Pure carbon in one structure gives us soft, black graphite. In another, we get super-hard, gorgeously transparent diamond. Both have been known since prehistory, yet it wasn’t until late into the 20th century that brand-new carbon structures – such as graphene, with completely different properties again – were discovered.
The number of chemical and mechanical combinations of even a tiny handful of elements is literally incalculable, even with the supercomputers of tomorrow. Yet we will need many thousands of new materials to achieve the future we dream of, with hypersonic aircraft, space tourism, super-efficient renewable and rechargeable energy sources and sustainable engineering. Materials science must be reinvented, urgently.
A new approach: audacious industrialisation
“Every breakthrough in materials science has been made by accident,” says Dr. Nils Ellendt, CEO of the Collaborative Research Centre 1232 Farbige Zustände* at the University of Bremen, Germany, “and we don’t have the time for that anymore.”
Instead, the new solution is an audacious industrialisation of the inventive process, powered by a factory line of creation and testing and underpinned by a wholly new approach to collecting, collating and using data. That’s where the Collaborative Research Centre comes in. It’s a major state-funded, cross-disciplinary effort to reinvent an entire field of research: the discovery of new materials.
“Biological evolution works by creating endless mutations of form, testing them in nature and storing the blueprint for the more successful in their DNA; the centre’s approach is to replicate the idea through machines and computers. But in years, not millennia,” says Dr. Ellendt.
The old way of developing new materials has been very successful. Inventors work alone or in small teams, following hunches or investigating anomalies. One of the best examples from recent years was the invention of the blue light-emitting diode, which led to the current revolution in low-cost, low-energy, reliable lighting. Japanese researcher Shuji Nakamura was working for lighting company Nichia on blue LEDs, a big goal for the industry, but was told to stop as his bosses didn’t think it worth the resources. Nakamura carried on in his own time, creating new variations in materials, testing their characteristics and using that information to inform his next choice of material to investigate.

Thus, he followed his hunches about new crystal structures that were generally considered flaws. He thought otherwise, and ended up sharing the Nobel Prize for Physics when he was proved right.
The trouble with such stories is that they don’t scale. There is a very small supply of Nakamuras. Industry has a voracious appetite for new materials, most not the star turns that lead to revolution but instead carefully selected for a particular job. For example, a new jet engine creates a range of pressures, temperatures and cyclic changes but can’t compromise on weight and manufacturability – a wider spectrum of materials to choose from directly increases designer options.
Unprecedented increases in efficiency
“A PhD materials science researcher might come up with four or five materials in the four or five years of their thesis. We want to do 400 to 500 a day.” says Dr. Ellendt. Crunch the numbers, and this means the 60 researchers at the centre must do the jobs of 100,000 researchers. That’s an increase in efficiency which, if replicated in European league football, would see a total of just six players compete across the continent each match day instead of the 10,000 professionals currently paid to do so.
And those 60 researchers aren’t all materials scientists. Thanks to funding from Deutsche Forschungsgemeinschaft (DFG, the German Research Foundation), the centre is able to bring together specialists for each stage in the creative pipeline – materials generation, processing and testing, as well as in the huge data enterprise that backs it all up.
To match that, machinery large and small is sprinkled across the Bremen campus. Some is big enough to pull apart girders. Others use X-rays to peek into the atomic structure of tiny samples, or strip away the surfaces of test materials with electric current.
It took a hundred years to get that right for tensile strength testing but we’ve got that down to two-and-a-half years
Dr. Nils Ellendt
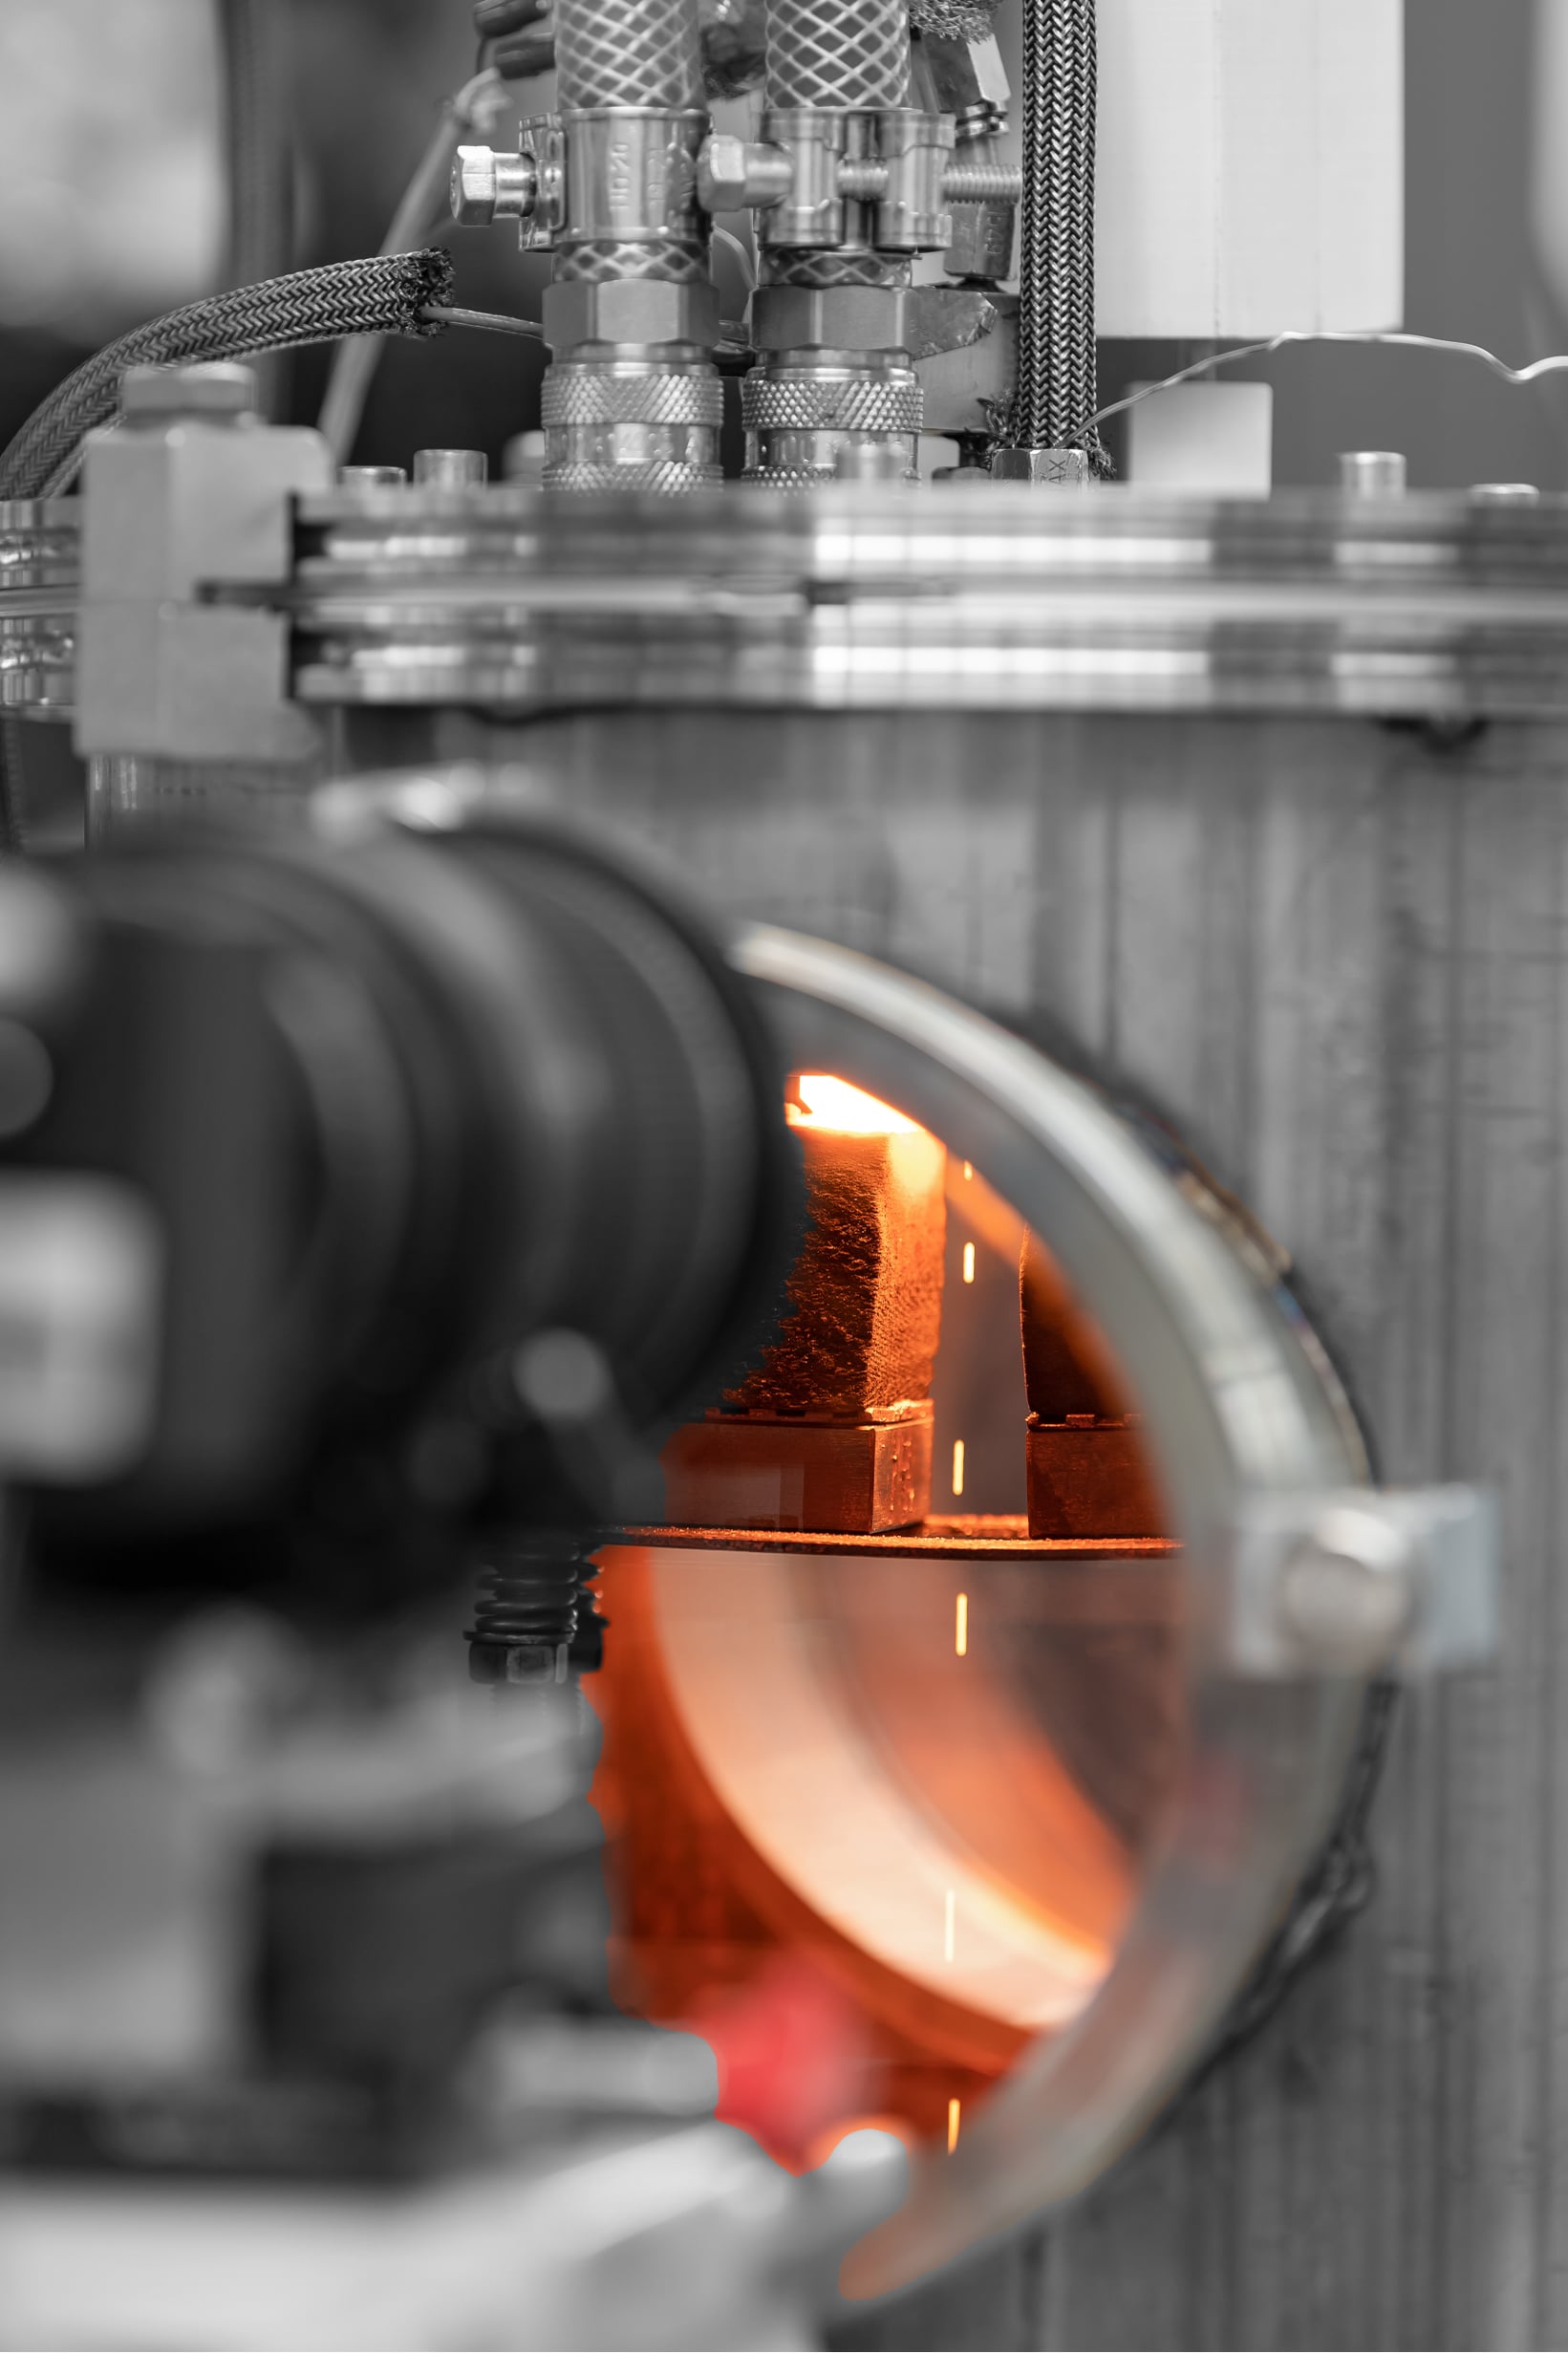
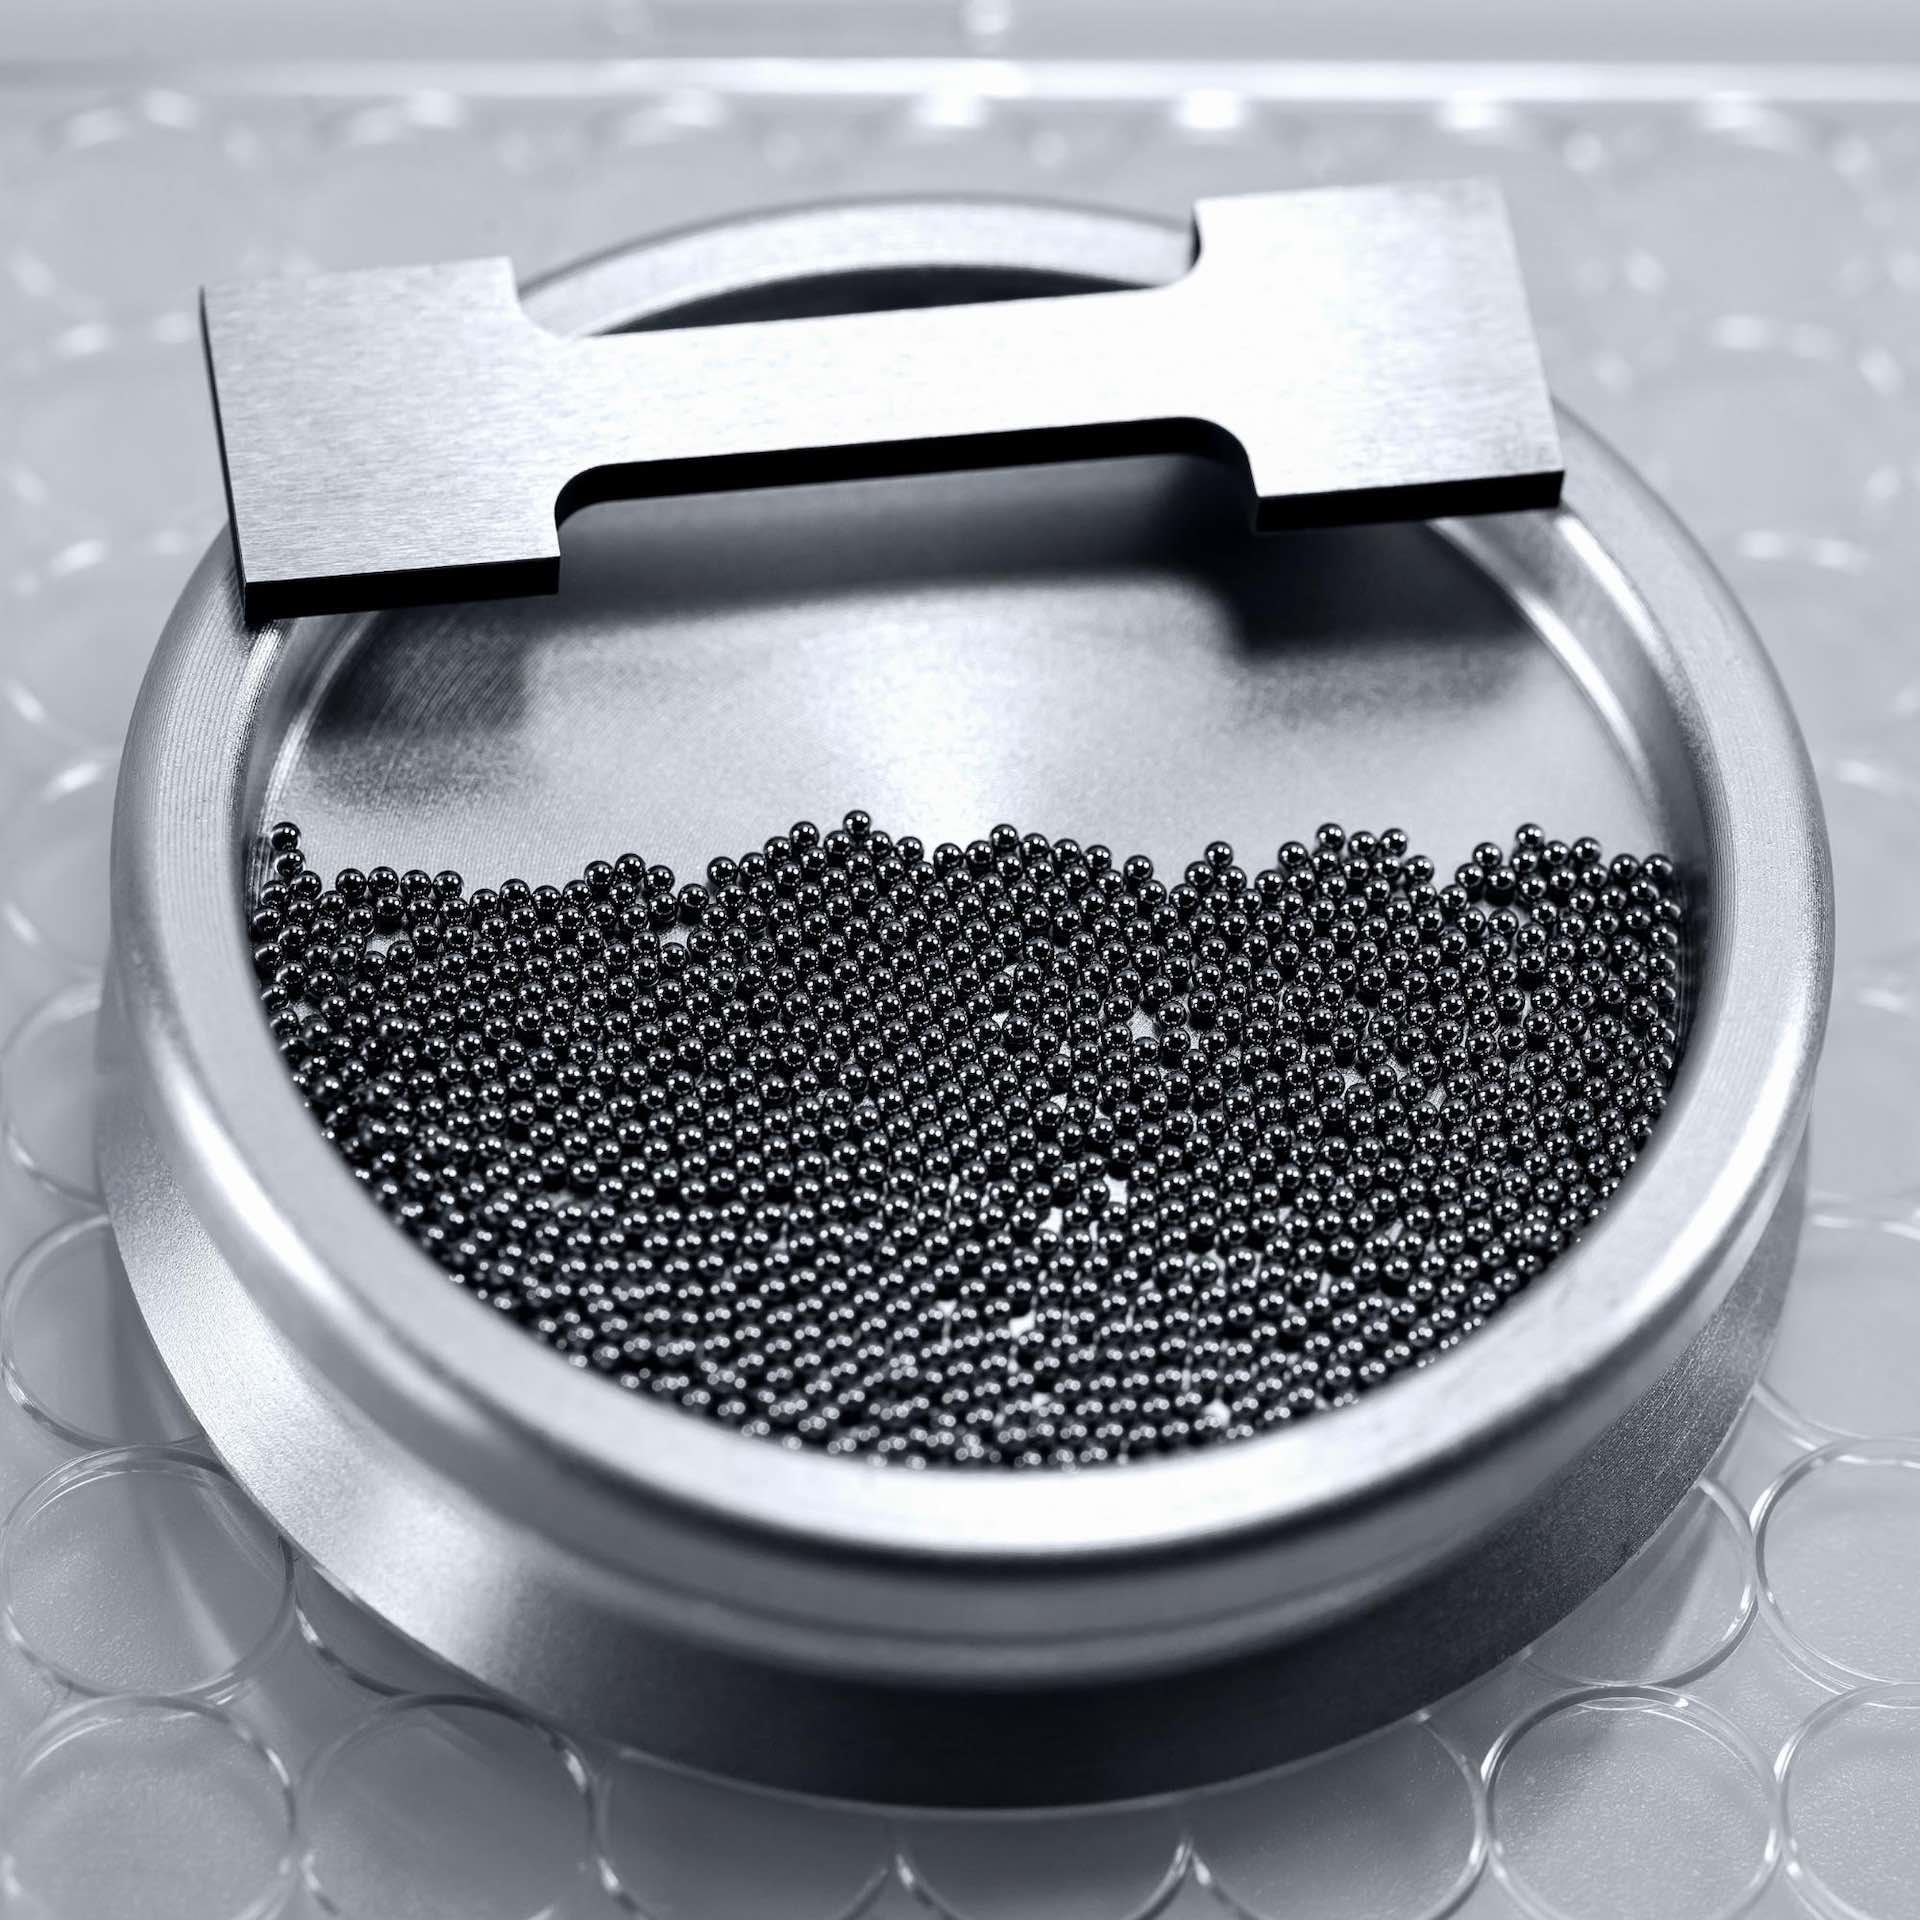
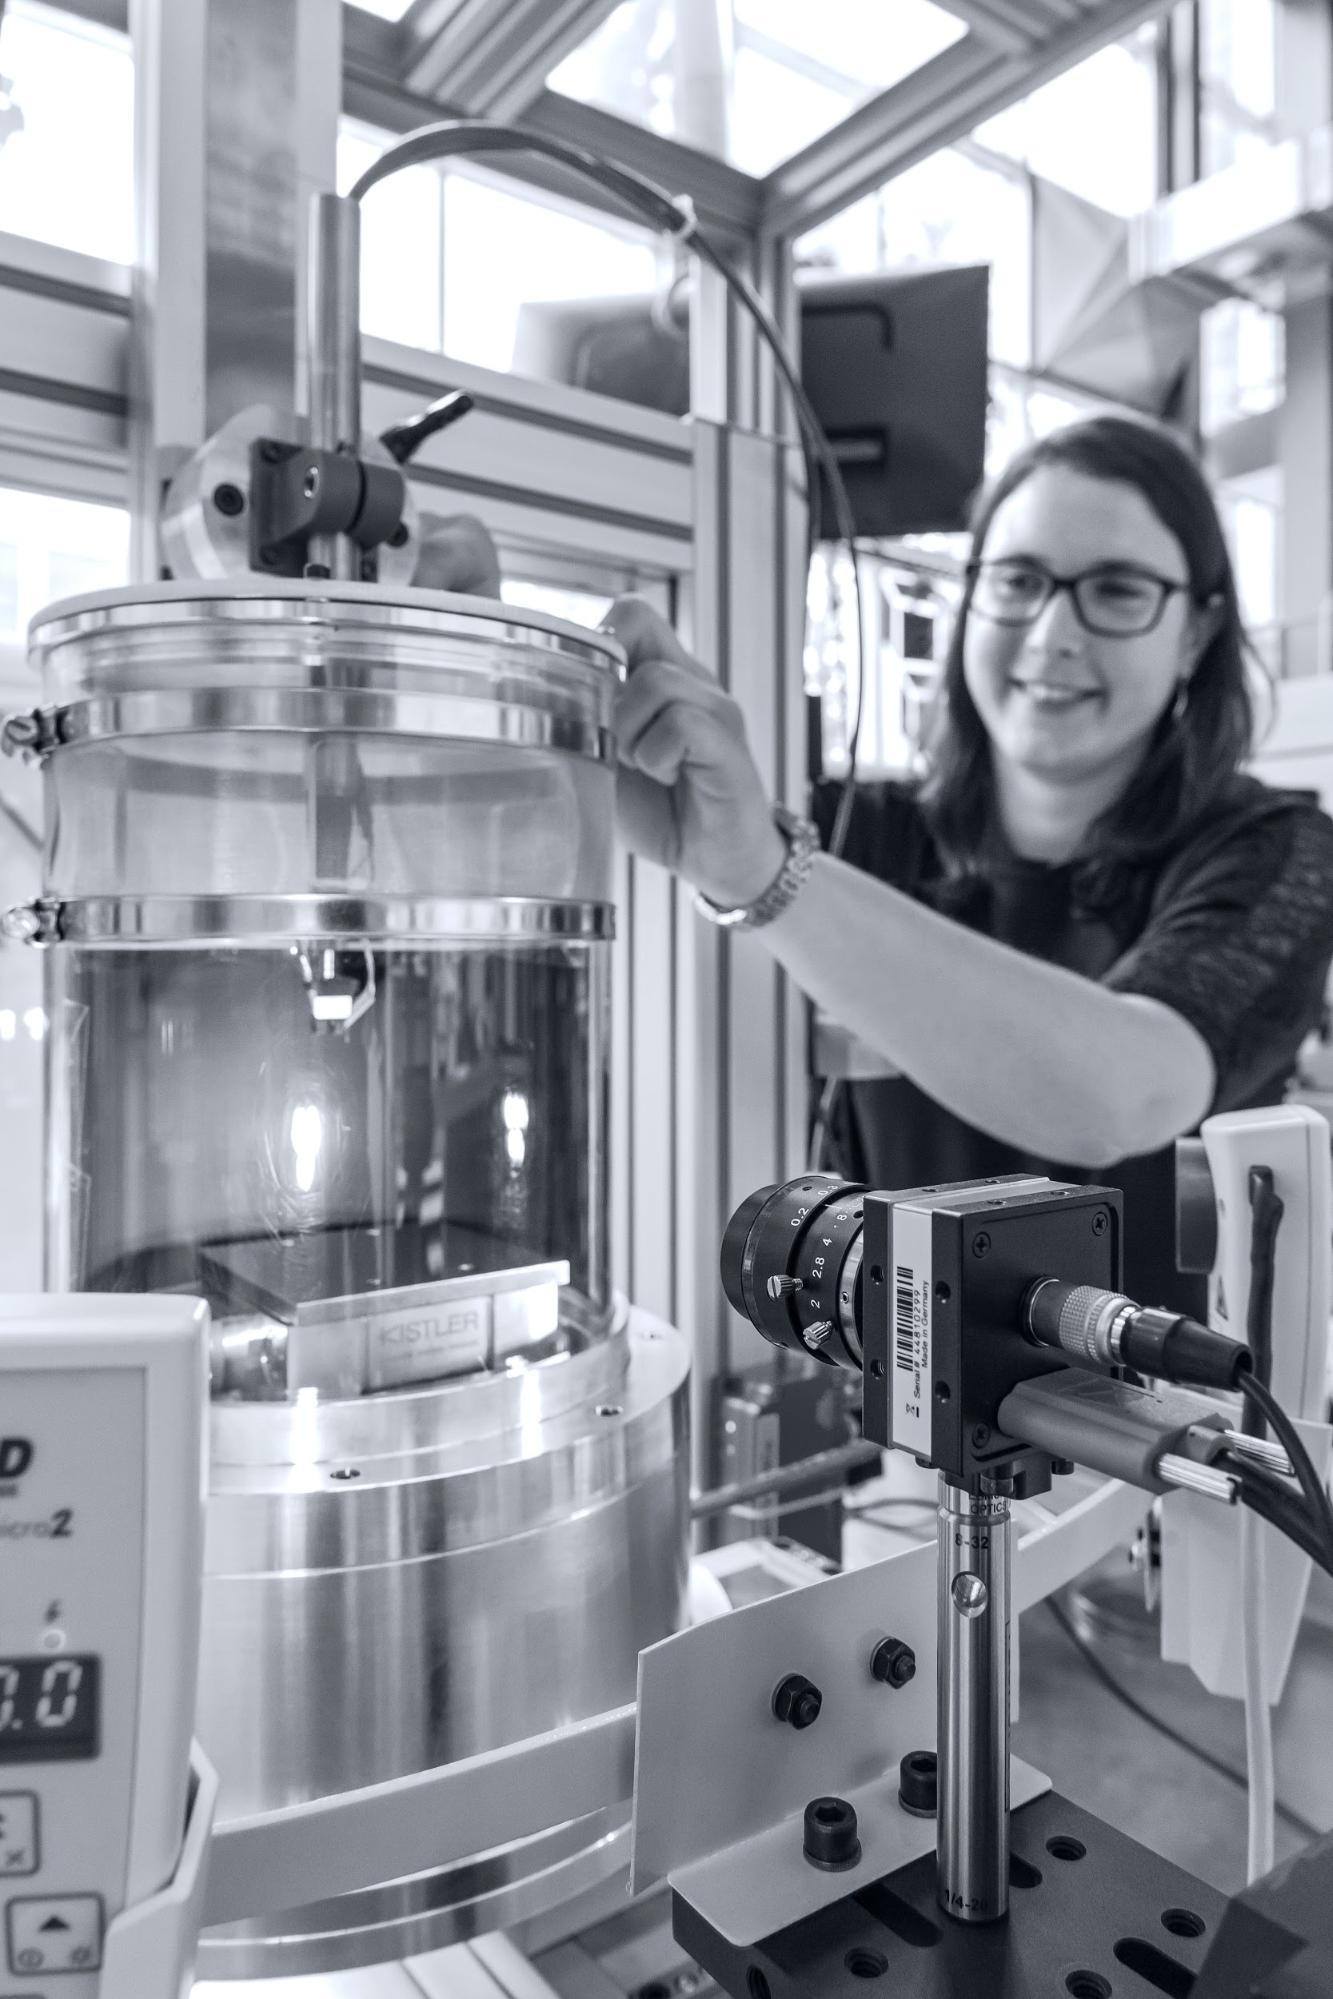
“Let’s take one example of many,” says Dr. Ellendt. “One investigation starts off with a stream of tiny molten steel drops, twenty or thirty a second. We drop them down a seven-metre tower filled with argon to let them form millimetre-sized spheres as they cool and harden. Not only can we change composition and production details, but we process them afterwards – heat treatment, hitting them with varying degrees of force, that sort of thing. Then we characterise them for hardness, ductility, and so on.”
Each step is something any materials scientist would do. But this time, they’re on a production line with high levels of automation. The number of variations in producing a single steel sphere, Dr. Ellendt points out, is larger than the total number of atoms in the universe. “No computer is going to simulate that in my career,” he says. “And I’ve got a good 30 years left.”
At the heart of it all: data
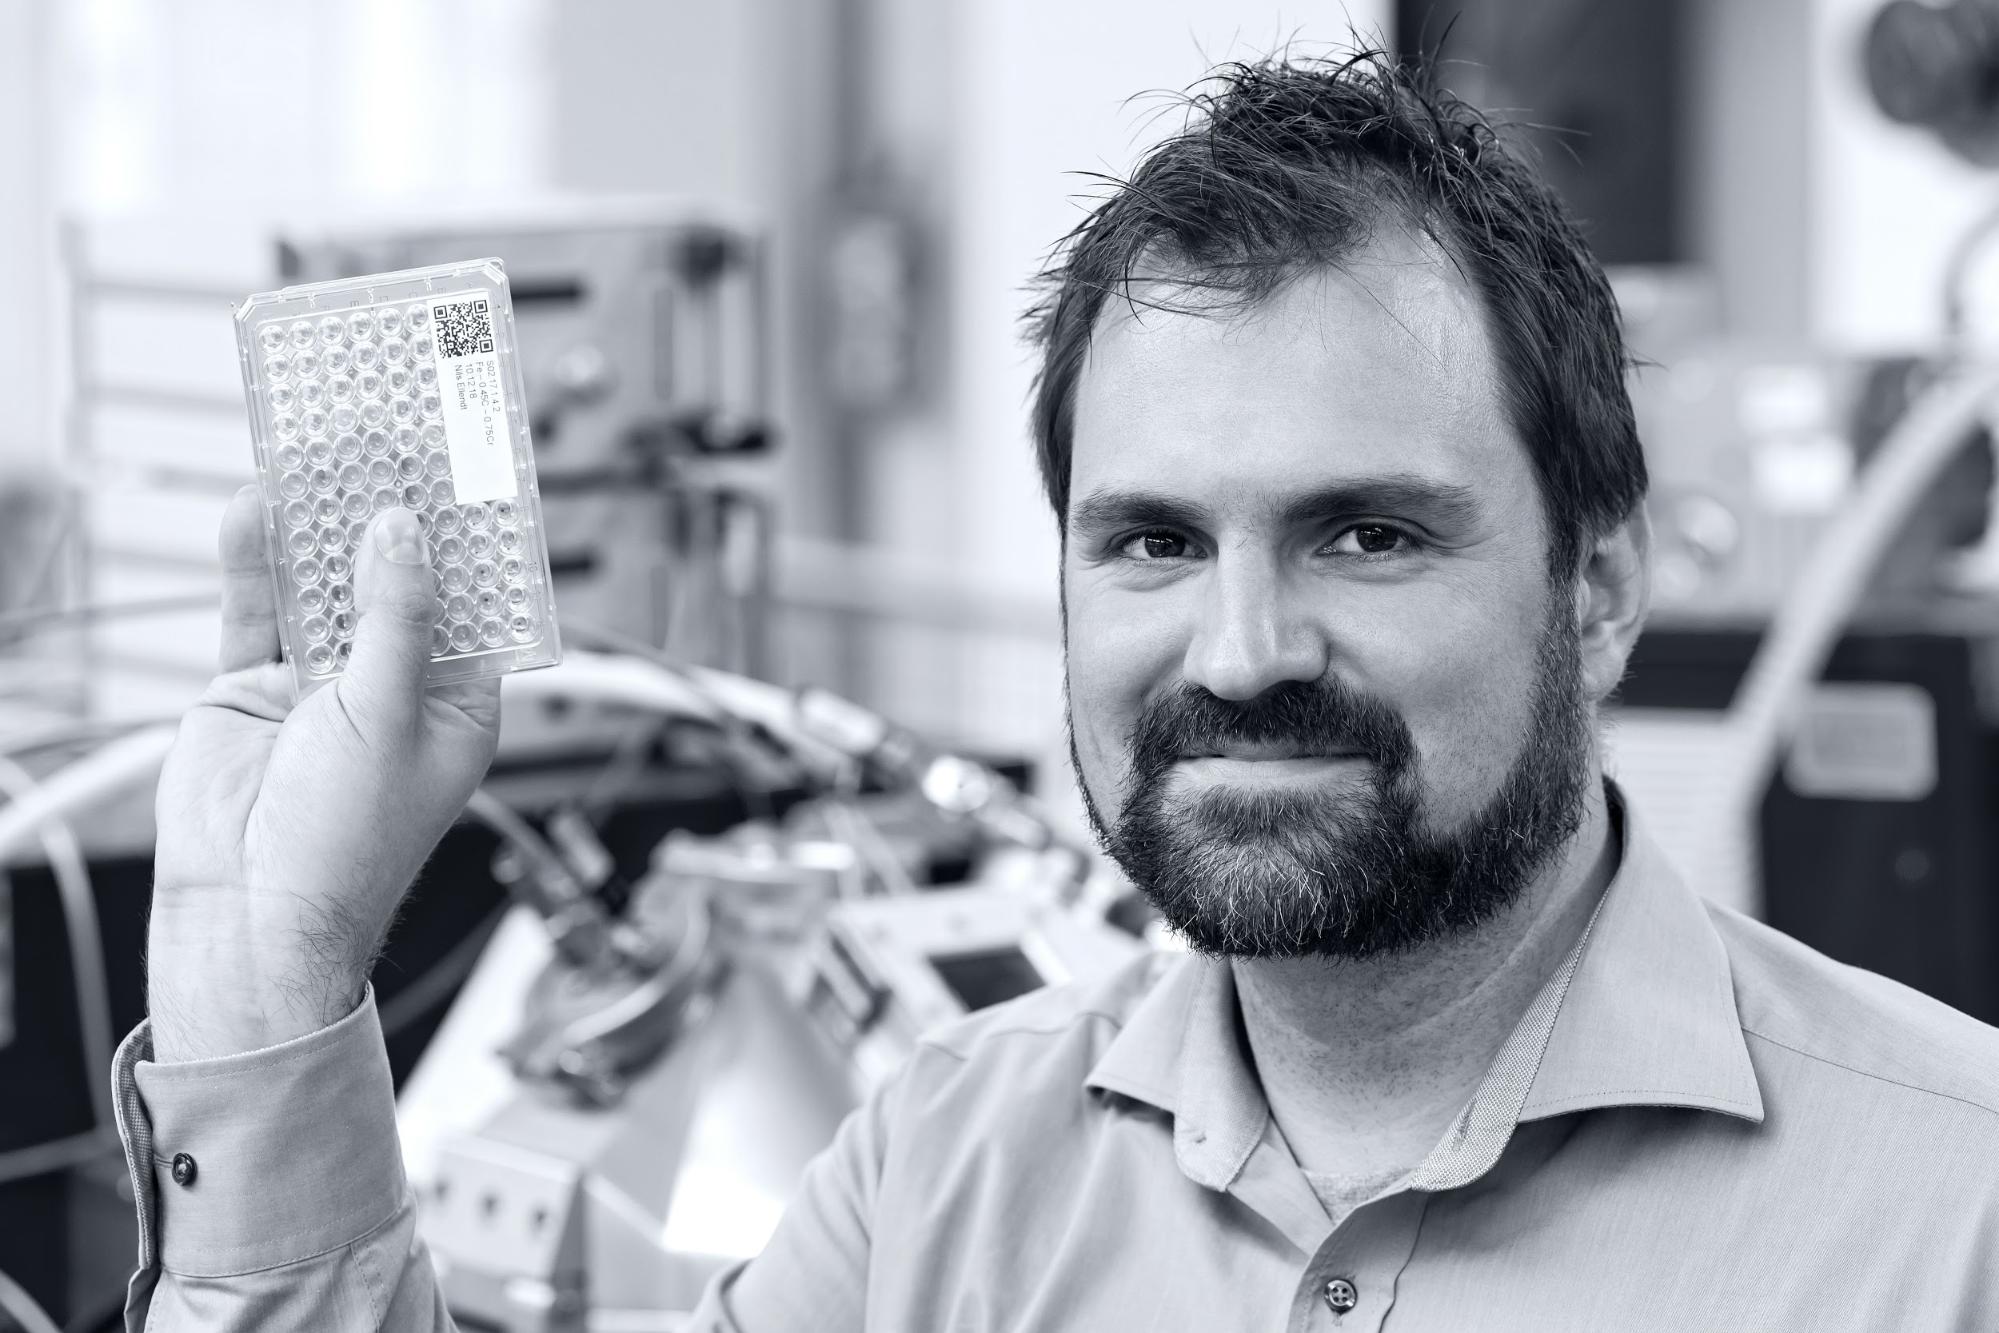
Although each stage of the process is sped up in different ways, and different classes of material need different processes, there is one common factor – data. “We store every bit of information about the production and testing process, as well as the results of the tests themselves, and this is new in materials science,” says Sebastian Huhn, Master of Science (Computer Engineering) and a PhD student, at the Collaborative Research Centre and the man responsible for building the data infrastructure which supports the materials research.
“If this information was even kept in the past, it was haphazard, in notebooks or incompatible formats. We put everything – everything – in one database and build what’s called a descriptor for each material. This has precise information about how it was created, and what its characteristics are. We can walk through the entire history of a sample. Database people find this boring, but it’s tremendously exciting for us materials scientists. We’ve never had anything like it.”
Of course, this system can’t just be created out of thin air. It too has to be bootstrapped, tested and refined. “We’re starting in phase one, developing the method with materials we know very well. At least, we thought we knew them very well; it’s surprising, once we go back to them, how little is really known.”
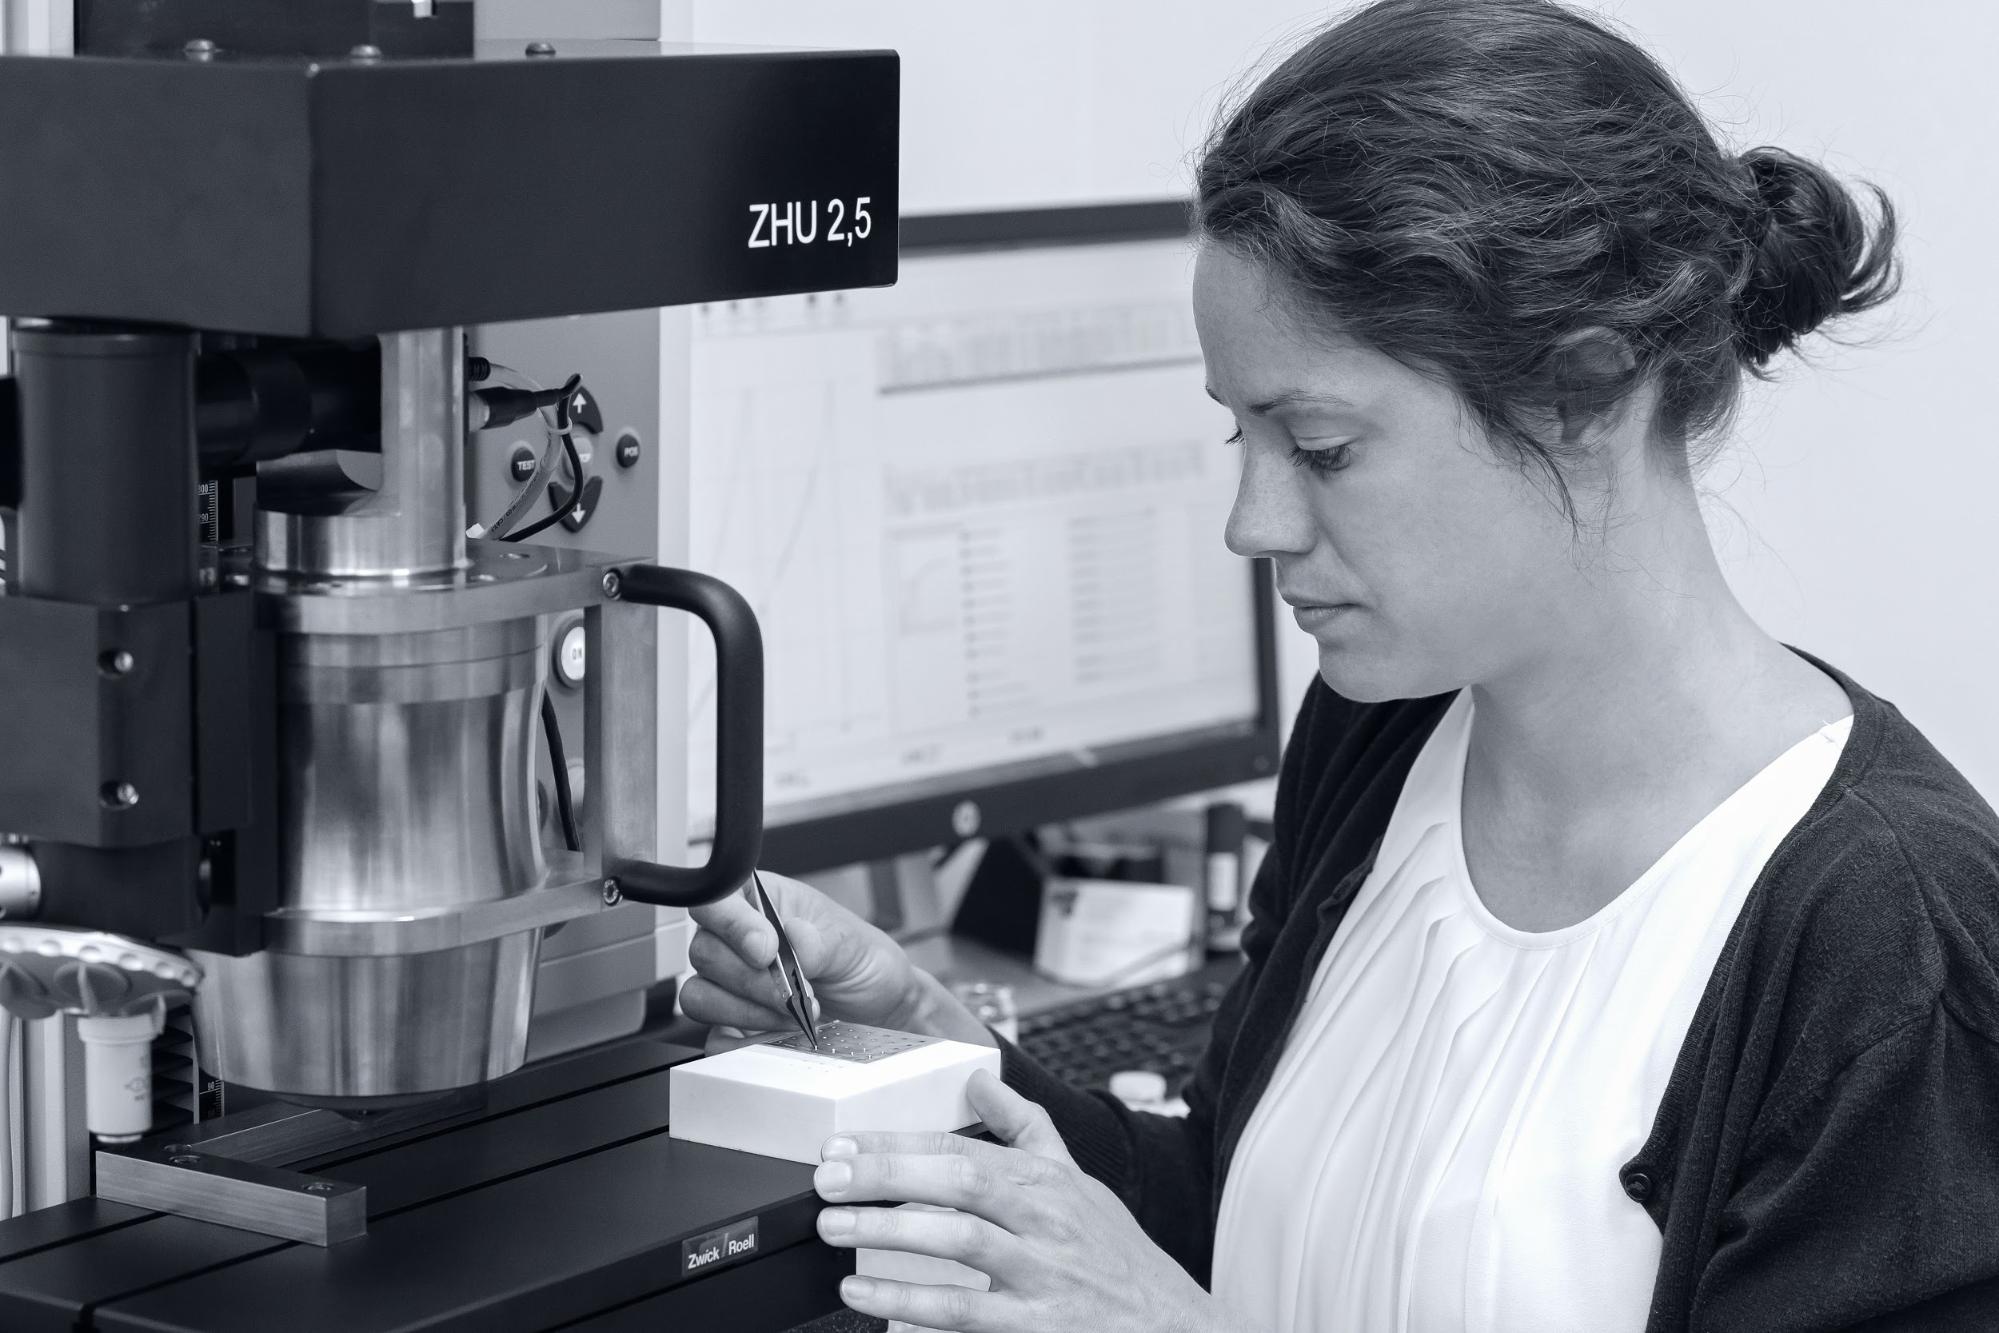
Along the way, the testing systems themselves have to be created and tuned. Back with the steel balls, a precisely delivered hammer blow can change the metal’s internal structure – but hammers have to be built that can do the same test 10 times and get very similar results. “It took a hundred years to get that right for tensile strength testing,” says Dr. Ellendt, “but we’ve got that down to two-and-a-half years.” The test results themselves can vary from a single number to, among other things, detailed imagery, X-ray diffraction data, electrochemical tests, and – in time – complete 3D scans.
Add in the fact that no machine manufacturers use the same format, even when doing the same tests, and the sheer mechanics of managing the data becomes just as important as any other aspect of the system. “We can see a worst case, or rather a best case, of a thousand samples a day producing half a terabyte of data apiece, so that’s serious engineering in its own right.”
Next: the search begins
The computer will end up telling us which experiments are smart to do, things that we’d ordinarily think of as crazy
Sebastian Huhn
Phase two happens when the tests are tuned and the results for known materials are consistent, reliable and accurate. Then the search for new materials begins, creating descriptors for the estimated million-plus samples that the centre intends to process by the end of this stage of its roadmap in 2028.
As the database builds up, it’ll become possible to query descriptors to find a material that matches a need, or that suggests a useful new avenue to explore. Moreover, it’s also possible to create predictor functions – analytics – that look at sets of descriptors and suggest changes to create new samples with desired characteristics. These changes are fed back into the system, the samples are made and the predictor is then tuned to be more accurate and more useful. “The computer will end up telling us which experiments are smart to do, things that we’d ordinarily think of as crazy,” says Sebastian.
If you think that sounds like machine learning and AI, that’s no coincidence. “We’ve got a lot of industry partners in automotive and aerospace,” he says, “with some, like Bosch, being particularly interested in machine learning. It’s not just working with our database, but adding ideas like machine-reading the scientific literature and combining that to build an ever-more nuanced picture. The next materials may not be found in the lab, but with a search algorithm.”
In the end, he predicts, “science may become a database and scientists, data miners, delivering discoveries from the desktop.”
New bridges to the future
Before that point, though, the centre is making some very concrete progress with ramifications outside its partnerships and research. “There’s a new initiative coming up in Germany for a national database of materials, and we’re leading the way,” says Dr. Ellendt. “We’re way ahead in the country, and there’s nothing like it internationally.” It’s not just an experimental scratchpad, he says: it’s designed for durability and the future. “The computer science and national strategists are very happy with what we’re doing now, but we’re thinking ahead.”
Although the data is being generated at public expense and will be made generally available, exactly how it will be used is itself going to be a journey of discovery. “It’s not just harder, lighter, stronger materials,” he says. “It’s finding materials that need less refining, that are more compatible with a sustainable environment. How few elements can we use, not how many.”
“Materials science is like any other. It’s about finding patterns. At the moment, it’s a huge unknown sea with a few little islands of knowledge. With our data-driven approach, we can find new bridges to connect ideas, and bring the science to a new state.”
That new thinking will be needed once again, now mankind is preparing to return to manned space exploration, first to revisit the Moon and thence onto Mars. Such long missions in such harsh environments will need new materials capable of radical new uses. NASA says that it expects Mars explorers to process Martian soil into forms capable of being 3D-printed into habitats and machinery, capable of resisting the high radiation and corrosive, abrasive environments reported by the rovers. A catalogue of a million new materials, together with the technology to produce and process thousands more as required, will give the new space age the sort of boost even Kennedy could not have foreseen.
MongoDB and University of Bremen
When the Collaborative Research Centre 1232 “Farbige Zustände” at Germany’s University of Bremen started to plan its data infrastructure in 2014, it first looked at standard structured databases. However, the centre’s researchers quickly realized the data sets they would be working with were extremely heterogeneous – and thus were better suited to unstructured database techniques. Materials science produces a huge variety of different sorts of data types, not just static lists of numbers, and has to adapt to new tests, so the underlying database has to be adaptable and not impose any limits on what it can store and process, now or in the future.
MongoDB was a good fit to handle this sort of data at scale, so the centre started to build its testing process around it. This choice became even more attractive when the centre considered the use case of algorithmic analysis of sample data, which was a very good match for the database’s aggregation pipeline. This feature applies successive transformations to documents in stages, matching the centre’s post-processing architecture. The set of operators from the database was extended using the eval statement, connecting from the Mongo shell to the database, which – with some further server-side scripts – provided access to predefined aggregation pipelines. This also loads dynamic matrices holding precalculated information on the dependencies and correlation of experiments, which helps normalise and transform data automatically. The centre considers MongoDB uniquely suited for this approach.
The data itself is collected through a number of methods. One is called descriptors, which are defined for each project. Every project has metadata defining a common set of values to be created and measured during experiments – what the physical units are, what constitutes a valid range, and what class of data is being collected. Every time a material is processed, such as a steel droplet being compressed or heated, it creates a host of new measurements describing its new state, and a shower of data describing the transformation. The data that describes the process, together with the data that describes what the process does to the sample, builds into a definition of the experiments and is processed when building the views.
For the actual process of data input, there is a system written in Node.js which establishes all the data processing and connections to the server running MongoDB. The data itself is separated in the database by sample and identified by an ID string. Another very important aspect is the presence of a set of flags, which are used during filtering and algorithmic analysis.
One of the unique aspects of the database is that it records the history of which processes a sample goes through, and this is stored in object ID-referenced sets of sequential arrays called steps. Each process step can also have files, meta-information and experimental information attached to it. Hierarchies refer to form inputs, JPEGs for microscopic views, and whatever extra references are appropriate. This part of the data set also contains information when two experiments need to cross-reference each other because of mutual dependencies. This is a very complete set of information, either for future researchers or engineers wanting to recreate samples, or for algorithmic searches for interesting common factors among samples.
The system also dynamically builds parsers that can process the actual experimental data, both to create characteristic values and to evaluate the quality of the experimental data.
The centre operates in phases, and is coming to the end of Phase 1, which was set for 2016-2020. The first prototypes of the database system were built on MongoDB in 2017, and operations are not yet at full scale, although things are ramping up. The centre quickly picked up on additional tools available, such as the administration and profiling toolsets. The initial proposal for the system also promised a form of SQL access for those who want it, which the Business Intelligence Connector provides.
During the centre’s second phase, not only will data collection be stepped up to production levels but the questions of who will get access and how they’ll get it will also be addressed. Currently, a lot of the interesting data available inside the aggregation pipeline is exposed only to computer scientists and mathematicians, but thoughts are turning to visualisation platform-based access via dynamic heat maps or surface plots. This would open up the data set of samples to a huge range of audiences.
If all goes to plan, by this stage the centre will have pioneered a complete revolution in materials science, not only in the creation of a massive new catalogue of potential engineering materials but in pioneering data and automation in creative engineering. Henry Ford didn’t just invent a good way to make the Model T, he changed the entire automotive industry, and many others beyond. The centre’s ambition is just as far-reaching.
Article by Rupert Goodwins. Photography by Jan Rathke.